Items related to Dashboarding with SAP Crystal Dashboard Design

Based on Microsoft Office Excel, SAP Crystal Dashboard software (aka, Xcelsius) allows you to convert your existing spreadsheets into exciting, visually interactive dashboards. Information in Excel is brought to life with dynamic graphs that allow the user to customize and visualize data in real time. While spreadsheet data is static and needs to be updated using cut-and-paste, dashboards automatically query databases or reports for the most current data.
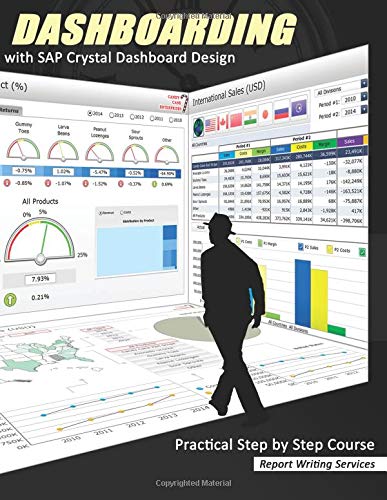
This book by Report Writing Services, designed as a 3-day training course, is perfect for self-study or an instructor-led classroom setting. The student learns by building dashboards (not by reading theory) and is exposed to a comprehensive collection of dashboard components, a wide range of design concepts, and practical spreadsheet programming techniques. Breadth of knowledge is emphasized over repetitious exercises, while dashboard standards and best practices are taught throughout the course.
The book consists of nine chapters in an easy to follow step-by-step format. All instructions are accompanied by detailed color illustrations that help the student create the dashboards quickly and easily. A new and increasingly challenging dashboard, which introduces and teaches new concepts, is built in each chapter. Student files, provided by the author, include a rich set of pre-constructed and mid-construction dashboards.
The chapters are knit together by an entertaining story about the fictional company, Candy Cane Enterprises. Protagonists Annie Heartland and Abel Goodman struggle to overcome corporate politics to build dashboards that reveal the hidden truth about the company’s finances, sales, production, client relations, and human resources. While learning to create dashboards, the student is carried on a journey from the skyscrapers of New York City to the islands of the South Pacific and the hills of Montana. Complete with cartoon images, intrigue, and a little romance, the story provides context and meaning to the tasks the student must perform.
During the course you will:
- become acquainted with the program window, menus, and toolbars
- discover the variety of components you can choose from to create dashboards
- learn how to use properties and settings of different objects
- study how to link objects to spreadsheet data
- find out how to set up connections between objects and make them influence each other
- learn to organize objects on the canvas by aligning and grouping them
- see how to organize data in the spreadsheet by distributing it among different sheets and tables
- write different Excel formulas to get the data you need
- learn many facets of effective dashboard design
- apply standards and best practices
- course book
- dashboards & student files (available from the author)
"synopsis" may belong to another edition of this title.
- PublisherCreateSpace Independent Publishing Platform
- Publication date2012
- ISBN 10 1480179817
- ISBN 13 9781480179813
- BindingPaperback
- Number of pages440
(No Available Copies)
Search Books: Create a WantIf you know the book but cannot find it on AbeBooks, we can automatically search for it on your behalf as new inventory is added. If it is added to AbeBooks by one of our member booksellers, we will notify you!
Create a Want